The best pen tester tools: sniffer and packet handling. Sniffer for Windows Intercepter-NG (instruction for use) Program for sniffing wifi windows
Interceptor is a multifunctional network tool that allows you to get data from traffic (passwords, messages in instant messengers, correspondence, etc.) and implement various MiTM attacks.
Intercepter interface
Main functionality
- Interception of messenger messages.
- Interception of cookies and passwords.
- Interception of activity (pages, files, data).
- Ability to spoof file downloads by adding malicious files. Can be used in conjunction with other utilities.
- Replacing Https certificates with Http.
Messenger Mode- allows you to check the correspondence that was sent in unencrypted form. It was used to intercept messages in such messengers as ICQ, AIM, JABBER messages.
Recovery Mode– recovery of useful data from traffic, from protocols that transmit traffic in the clear. When the victim views files, pages, data, it is possible to partially or completely intercept them. Additionally, you can specify the size of the files so as not to download the program in small parts. This information can be used for analysis.
Password Mode– mode for working with cookies. Thus, it is possible to gain access to the visited files of the victim.
scan mode– the main mode for testing. To start scanning, press right click mouse Smart Scan. After scanning, the window will display all network members, their operating system and other parameters.
Additionally, in this mode, you can scan ports. You need to use the Scan Ports feature. Of course, there are much more functional utilities for this, but the presence of this function is an important point.
If we are interested in a targeted attack on the network, then after scanning, we need to add the target IP to Nat using the (Add to Nat) command. In another window, it will be possible to carry out other attacks.
Nat mode. The main mode, which allows you to carry out a number of ARP attacks. This is the main window that allows targeted attacks.
DHCP mode. This is a mode that allows you to raise your DHCP server to implement DHCP attacks in the middle.
Some types of attacks that can be carried out
Website spoofing
To spoof the victim's site, you need to go to Target, after that you need to specify the site and its substitution. Thus, you can replace a lot of sites. It all depends on how good the fake is.
Website spoofing
Example for VK.com
Choosing a MiTM attack
Changing the Injection Rule
As a result, the victim opens a fake site when requested vk.com. And in the password mode, there should be the login and password of the victim:
To conduct a targeted attack, you must select a victim from the list and add it to the target. This can be done with the right mouse button.
Additions of MiTm attack
Now you can recover various data from traffic in Ressurection Mode.
Files and information of the victim through a MiTm attack
Traffic spoofing
Specifying Settings
After that, the victim will change the request "trust" to "loser".
Additionally, you can kill cookies so that the victim logs out of all accounts and re-authorizes. This will intercept logins and passwords.
Destruction of cookies
How to see a potential sniferr on the network using Intercepter?
Using the Promisc Detection option, you can detect a device that is scanning on the local network. After scanning, the status column will be "Sniffer". This is the first way that allows you to define scanning on the local network.
Sniffer detection
SDR HackRF Device
SDR is a kind of radio receiver that allows you to work with different radio frequency parameters. Thus, it is possible to intercept the signal of Wi-Fi, GSM, LTE, etc.
HackRF is a complete $300 SDR device. Project author Michael Ossman is developing successful devices in this direction. Previously, the Ubertooth Bluetooth sniffer was developed and successfully implemented. HackRF is a successful project that has raised over 600k on Kickstarter. 500 such devices have already been implemented for beta testing.
HackRF operates in the frequency range from 30 MHz to 6 GHz. The sampling frequency is 20 MHz, which allows you to intercept the signals of Wi-FI and LTE networks.
How to protect yourself at the local level?
First, let's use the SoftPerfect WiFi Guard software. There is a portable version that takes no more than 4 MB. It allows you to scan your network and display which devices are displayed on it. It has settings that allow you to choose network card and the maximum number of scanned devices. Additionally, you can set the scan interval.
Ability to add comments for users
Conclusion
Thus, we have considered in practice how to use software to intercept data within the network. We considered several specific attacks that allow you to get login data, as well as other information. Additionally, we considered SoftPerfect WiFi Guard, which allows you to protect the local network from listening to traffic at a primitive level.


The wifi network packet sniffer module can be used on both normal and third monitor modes, but it also supports a option, the extended mode, for capturing the Wi-Fi network traffic generated by your equipment.
The extended mode allows you to use the while your wireless card is connected to a Wi-Fi network. Apart from viewing signaling packets (beacons, probe requests, probe responses, data packets, etc.), you will be able to view all the TCP, UDP, or Wi-Fi broadcast traffic generated by your system while connected. This way, you will be able to view and analyze all the web browsing ( HTTP) traffic, or any other network connection sent by the Wi-Fi network you are connected to.
This capture mode does not allow you to view Wi-Fi traffic from other channels, since your wireless card is working at a fixed frequency.
The Wi-Fi network sniffer on extended mode and the network packet capture mode sectors are long-awaited new features on Acrylic Wi-Fi Professional v2.3, which is expected to be launched within the next few days.
Download Wireless Network Sniffer for Windows 7/8/8.1/10
If you do not need to view Wi-Fi network packets or use a wifi network traffic sniffer, download , a free Wi-Fi network and channel sniffer for Windows that allows you to view all the wireless networks within reach. This version supports normal capture and monitor modes.
If you need complete wireless network behavior information, wifi network sniffer is the right solution for you, since it supports all three Wi-Fi network capture modes, providing WiFi network packet information in real time. A very useful tool for improving wireless network performance, detecting incidents, and learning more about Wi-Fi networking. Try it for free!
And for advanced users, the Acrylic Wi-Fi driver allows you to .
SmartSniff allows you to intercept network traffic and display its content in ASCII. The program captures packets passing through the network adapter and displays the contents of the packets in text form (http, pop3, smtp, ftp protocols) and in the form of a hexadecimal dump. To capture TCP/IP packets, SmartSniff uses the following techniques: raw sockets - RAW Sockets, WinCap Capture Driver and Microsoft Network Monitor Driver. The program supports Russian and is easy to use.
Packet sniffer program
 |
SmartSniff displays the following information: protocol name, local and remote address, local and remote port, local host, service name, data volume, total size, capture time and last packet time, duration, local and remote MAC address, countries and contents of the data packet . The program has flexible settings, it has the function of a capture filter, unpacking http responses, converting ip addresses, the utility is minimized to the system tray. SmartSniff generates a packet flow report in the form HTML pages. It is possible to export TCP/IP streams in the program.
The Wireshark program will be a great helper for those users who need to make a detailed analysis of network packets - traffic computer network. The sniffer easily interacts with such common protocols as netbios, fddi, nntp, icq, x25, dns, irc, nfs, http, tcp, ipv6 and many others. Allows the analysis to divide the network packet into the appropriate components, according to a specific protocol, and display readable information on the screen in numerical form.
supports a huge number of different formats of transmitted and received information, is able to open files that are in use by other utilities. The principle of operation is that the network card switches to broadcast mode and the interception of network packets that are in its visibility zone begins. Able to work as a program for intercepting wifi packets.
How to use wireshark
The program examines the contents of information packets that pass through the network. To launch and use the results of the sniffer's work, no specific knowledge is required, you just need to open it in the "Start" menu or click on the icon on the desktop (its launch is no different from any other Windows programs). A special feature of the utility allows it to capture information packets, carefully decrypt their contents and issue them to the user for analysis.Having launched wireshark, you will see the main menu of the program on the screen, which is located at the top of the window. With the help of it, the utility is managed. If you need to download files that store data about packages caught in previous sessions, as well as save data about other packages mined in a new session, then you need the "File" tab for this.

To launch the network packet capture function, the user must click on the "Capture" icon, then find a special menu section called "Interfaces", with which you can open a separate "Wireshark Capture Interfaces" window, where all available network interfaces should be shown, through which will capture the required data packets. In the case when the program (sniffer) is able to detect only one suitable interface, it will display all the important information about it on the screen.
The results of the utility's operation are direct evidence that, even if users themselves are not engaged (at a given time) in the transfer of any data, the exchange of information does not stop on the network. After all, the principle of operation of a local network is that in order to maintain it in working mode, each of its elements (computer, switch and other devices) continuously exchange service information with each other, therefore, similar network tools are designed to intercept such packets.

There is also a version for Linux systems.
It should be noted that sniffer is extremely useful for network administrators and computer security services, because the utility allows you to identify potentially unprotected network nodes - probable areas that can be attacked by hackers.
In addition to its intended purpose, Wireshark can be used as a tool for monitoring and further analyzing network traffic in order to organize an attack on unprotected sections of the network, because the intercepted traffic can be used to achieve various goals.
To work with large wireless networks, there are a sufficient number of good multifunctional software solutions on the market that allow for comprehensive testing of WiFi networks. Often, however, for a quick look at the airwaves during design, deployment, or troubleshooting, you'll find it easier to use a simpler, free toolkit. We present to your attention an overview of the most interesting free programs for diagnosing WiFi networks.
In this article, we will introduce you to nine free software tools - most of them are based on operating systems. Windows systems, others for macOS or Android that will provide you with basic information about existing WiFi signals in the area: SSIDs, signal levels, channels used, MAC addresses, and security types of a particular network. Some of them can detect hidden SSIDs, detect noise levels, or provide statistics on the success and failure of packets sent and received on your wireless connection. One of the solutions includes a WiFi password cracking toolkit, which will be extremely useful for finding vulnerabilities and security assessments when testing your wireless network's hackability.
We also note that most of the tools described below are free versions of commercial solutions distributed by the same vendor, but with reduced functionality.

Scanner wireless local networks Acrylic WiFi Home is a stripped down version of Tarlogic Security's commercial solution. Version 3.1, considered within the framework of this review article, attracts attention, primarily due to the detailing of the wireless environment and advanced graphic capabilities displaying the collected information. The functionality of this solution includes: an overview of the found WiFi networks supporting 802.11 a/b/g/n/ac standards; detection of unauthorized access points and display of connected clients; scanning and analysis of WiFi channels used by wireless networks at frequencies of 2.4 GHz and 5 GHz; plotting the level of the received signal and its power for WiFi access points.
WiFi Scanner for Windows Acrylic WiFi Home will allow you to scan and view available wireless networks in real time, provide information about detected WiFi networks (SSID and BSSID), their type of protection and about wireless devices connected to the network at the moment, and will also allow you to get a list WiFi passwords(installed by default by manufacturers) thanks to the built-in plugin system.
As a free product, Acrylic WiFi Home 3.1 has a simple yet attractive GUI. A detailed list of SSIDs is located at the top of the application. Here, in particular, you can find: negative values in dBm for the received signal strength indicator (Received Signal Strength Indicator, RSSI), 802.11 standard supported by access points or WiFi routers (including 802.11ac), manufacturer name, model and MAC addresses network devices. The solution recognizes the bandwidth used and displays all the channels used for this. It does not look for hidden SSIDs, but it can show them if it finds network data indicating the presence of hidden networks. The application also has a functionality for inventorying the work of WiFi networks, allowing you to assign and save the names of detected SSIDs and / or clients (for the free version, this feature has quantitative restrictions on use).
At the bottom of the application screen, by default, visual rating information is displayed on the network characteristics of the selected SSID. Also here is a graph of the signal strength and power of all detected access points. When switching to the advanced mode of displaying the status of wireless networks, you will receive two additional graphs - for the 2.4 GHz and 5 GHz bands - which simultaneously displays both information about the channels used, including those combined into one "wide" channel, and signal strength data.
It is extremely inconvenient to export or save the captured data, since the developer company software decided to over-cut this functionality in the free solution: you can copy at most one line of data to the clipboard and then paste the text into Text Document or spreadsheet. There is also a feature for posting a screenshot to Twitter.
All in all, Acrylic WiFi Home is a good software WLAN scanner, especially since it costs nothing. It collects all the basic information about your wireless space and visually displays the data in both text and graphical form, which is great for simple WiFi network diagnostic tasks. The main disadvantage of this solution can be considered big problems with data export, or rather, the actual absence of such an opportunity in view of the functionality cut down by the manufacturer in the free solution.
AirScout Live (Android)

The AirScout Live app from Greenlee turns your Android smartphone into a handy and portable WiFi network analyzer. AirScout Live has seven modes of operation, four of which can be used completely free of charge without any restrictions for Android devices. The commercial version, unlike the free version, is compatible with most desktop computers (Windows) and mobile devices(Android and iOS). With the help of basic functionality, you can quickly, mobilely and, importantly, free of charge solve problems related to insufficient WiFi signal level in some places of your office or home.
AirScout live will show you all the characteristics of the access points found within range, from signal strength and security protocols to hardware capabilities. It will allow you to determine the least loaded channel, measure the signal strength at each point of the WiFi network and identify places with insufficient signal strength. Help identify sources of interference by analyzing channel usage parameters in the 2.4 GHz and 5 GHz bands. Using the program, you can choose the optimal location for the location of access points in order to provide the highest quality coverage of the premises with a WiFi network and configure it to maximum performance without buying additional equipment. In addition, the AirScout app allows you to take a picture of your WiFi network and save it locally or upload it to the cloud.
AirScout Live is a very easy to use application that does not require any additional training. The user interface looks attractive and intuitive. The first two menu items - "AP Schedule" and "AP Table" - will provide you with clear and comprehensive information about all the characteristics of access points that are in the visibility zone. Access point coverage graphs will visually show you the dependence of the signal level of each of them and the load on the channels in the 2.4 GHz and 5 GHz bands. Extended tabular information about each access point (SSID, Mac address, equipment vendor, channel used, channel width, received signal level in dBm and security settings) are available in the second menu item.
The "Time Graph" item will allow you to see all the access points that your Android device has detected in the monitored location, and their signal level change graph in dBm with reference to time. So, for example, if you are exploring a network that consists of multiple access points, this information will help you understand what signal level each of them will be in this place, and how the client device will switch between them. In addition, selecting a specific access point highlights its signal strength, which helps visual perception of information.
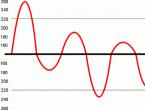
The “Signal Strength” item will allow you to visually test the signal strength for each access point over time. You can select a specific SSID and see the current, as well as the minimum and maximum signal strength recorded by the device for this access point. The original interpretation of the results obtained in the form of a red-yellow-green speedometer will allow you to visually verify whether this or that function will work in this particular place or not. For example, a stable signal strength in the green zone will tell you that here you will not have problems with such resource-intensive technologies as voice over IP or video streaming in Full format HD. Being in the yellow zone will indicate the availability of only web surfing. Well, the red zone will mean big problems with receiving a signal from this access point in this place.
For use additional features, which are not available in the free version of the software without additional hardware (detection of the most common problems: suboptimal signal coverage or incorrect channel selection; identification of sources of interference, including from "non-WiFi" devices; optimization of WiFi network configurations adjacent to networks 802.15.4 standard; tuning WiFi performance by comparing signal strength and usage; Ookla speed test and more) you will need an AirScout controller or a kit that includes a controller and remote clients.
AirScout Live is a great application that, above all, attracts with its mobility. Agree, having a tool that will always be at hand is worth a lot. The free version of the product gives you all the information you need to quickly analyze the health of small office or home WiFi networks and identify underlying performance issues. Intuitive interface and competent graphic design of the obtained measurement results not only leave a good impression, but also help to speed up the work with the application.

Cain & Abel is a multi-purpose application for operating systems Windows for recovering and cracking passwords, which is also equipped with tools for intercepting and analyzing network traffic, including WiFi networks. Like the previous solution (Acrylic WiFi Home), Cain & Abel is a powerful network analyzer capable of capturing and processing the majority of wireless network traffic.
Its GUI has a relatively ancient, simplified look. The toolbar (the old style with icons at the top of the screen) is used to launch various utilities. Access to the main functional parts of the application is carried out through window tabs.
Through the “Wireless” tab, we get access to functional tools for analyzing the network traffic of WiFi networks. In addition to the usual information about SSIDs and various signal information, you can also find a list and detailed information about connected clients here. For access points and clients, Cain & Abel provides information on the number of detected packets: all packets, WEP Initialization Vector (WEP IV), and ARP requests. Any hidden SSIDs found from the captured packets will be displayed in the GUI. Most of the captured statuses and data can be exported to a simple text file.
Despite the huge functional potential of this solution, such shortcomings as the lack of visual graphs, as well as the inability to recognize access points of the 802.11ac standard and determine wider channels, do not allow calling Cain & Abel the best choice for monitoring and analyzing WiFi networks. This solution is worth paying attention to if your tasks go far beyond simple traffic analysis. With it, you can recover passwords for Windows OS, perform attacks to obtain lost credentials, study VoIP data on the network, analyze packet routing, and much more. This is a really powerful toolkit for a system administrator with wide powers.

Ekahau HeatMapper is a mapping software tool for deploying small home-level wireless networks and determining the best location for installing an access point. This is simplified free version professional solutions from Ekahau. The software provides the same network information as the WiFi Wireless Scanner, but it also generates a WiFi heat map so you can visualize signal levels at a glance. As part of this review we will talk about version 1.1.4.
The software offers the possibility of creating a plan or layout of the object being investigated, as well as designing a wireless network topology on a grid for approximate orientation.
The left side of the main UI screen displays a list of wireless networks and their details sorted by signal, channel, SSID, MAC address, and security type. This list includes basic information, but does not include dBm and percentage values. In addition, the application does not recognize networks that support the 802.11ac standard, identifying them as 802.11n.
Using Ekahau HeatMapper, as with other mapping tools, you plot your current location on a map as you walk around a building to generate a heatmap of WiFi coverage. Ekahau HeatMapper will automatically calculate the location of hotspots and place them on the map. Once all the data has been collected, an interactive heat map of WiFi coverage will be generated. So, for example, when you hover over the access point icon, its coverage will be highlighted separately; and hovering over an area of the heatmap will pop up a tooltip for the received signal strength indicator with a negative dBm value for that point.
According to reviews software solution Ekahau HeatMapper is an overly simplified WiFi map scanner: manufacturers have removed almost all additional functionality from the free version, making this decision really home version. Also, the only option available to export or save is to simply take a screenshot of the map.
However, the Ekahau HeatMapper solution can be used for smaller networks or to get a basic understanding of how more professional map-based tools work.

The Homedale Software Utility is a relatively simple and portable (no installation required) wireless network scanner for Windows (version 1.75 currently available) and macOS (version 1.03 currently available) with an optional command line interface. Beyond Display basic information about wireless networks and signals, this utility also supports GPS positioning and other positioning technologies.
This utility has a simple graphical interface that looks more like a multi-tab dialog box than full application. The first tab "Adapters" displays a list of all network adapters, as well as their IP gateways and MAC addresses.
The Access Points tab contains many important information. It does not contain information about the 802.11 standard of each SSID, but here you will find all supported data rates, as well as the numbers of all channels used by each SSID at a given time, including those with a larger channel width. It also does not list hidden networks, but shows other network data that indicates the presence of hidden SSIDs. Also a very useful feature is the ability to save notes for individual SSIDs, which can then be included in any data export.
In the Access Point Signal Graph tab, you will find the change in negative dBm values for the received signal strength over time for all selected SSIDs. The implementation of access to this functionality cannot be called very convenient and intuitive - the choice of wireless networks for monitoring and comparison is done by double-clicking on the desired SSID from the list of the previous "Access Points" tab.
The "Frequency of use" tab illustrates in real time a graphical dependence of the frequencies used by each SSID (for convenience, divided into channels) and signal strength values. The channel usage visualization is displayed for the 2.4 GHz band and each subset of the 5 GHz band. The utility performs its task - it visually demonstrates the busyness of each channel - but it would be more convenient if we could have a single idea of the 5 GHz frequency, instead of dividing it into four separate graphs.
In addition, Homedale offers excellent opportunities, both for free application, to export the collected data. For example, it supports saving a network list in tabular form in CSV format, logging the results of each scan (it will be useful if you are moving during a scan), as well as saving an image of each graph.
Despite a very simple graphical user interface, the Homedale utility provides more advanced functionality than you might expect from it. In addition, I would like to note the rather impressive, as for a free program, the ability to record and export data, as well as determine the location.

LizardSystems offers a free, non-commercial version of their WiFi Scanner software that has the same features and functionality as their paid product. Version 3.4 of the solution is currently available. In addition to the WiFi scanner, this solution also offers great functionality for analysis and reporting.
The application has a modern graphical interface that is intuitive and easy to use. The Scanner tab provides a list of detected SSIDs. In addition to the standard detailed information here you will also find signal strength values both in negative dBm values and as percentages. It even shows the number of clients that are connected to each SSID. Also, along with the 802.11 standards specification, the solution can detect and report multiple channels used by any SSIDs with a larger channel width.
You can use the list of visible SSIDs to filter input by the following parameters: signal strength, supported 802.11 standard, security types, and used frequency bands. At the bottom of the Scanner tab are graphs that you can switch between. In addition to typical graphs showing signal strength and channels used, visualizations of data rates, channel occupancy and number of clients are also available. The bottom of the screen displays information about the current connection. In the "Advanced Information" tab you will find various information about network activity, up to the number of unprocessed packets.
The Current Connection tab displays more detailed information about the current wireless connection. This is where you can access and manage the list of wireless network profiles saved in Windows 10, which can be useful as this latest version The Windows operating system no longer provides native access to and management of this list. On the "Statistics" tab wireless communication» Graphs and statistics for various types packets, both for the physical (PHY) layer and for the data link (MAC) layer, which will be useful for advanced network analysis.
The LizardSystems WiFi Scanner software solution offers advanced export and reporting capabilities. Basic functionality allows you to save a list of networks in text file. In addition, you can generate reports with a summary of the network types found by the scan, with all logged SSIDs, any comments you add, and graph snapshots. These are pretty impressive features for a free WiFi scanner.
Thus, LizardSystems WiFi Scanner really impresses with its functionality, including data output filtering and reporting capabilities, as well as advanced data packet information. It can be an important part of your WiFi maintenance and testing toolkit, but keep in mind that the free license is for personal use only.
NetSpot (Windows and macOS)

NetSpot App is a software solution for researching, analyzing and improving WiFi networks. The commercial version uses a mapping tool for thermal imaging of coverage areas, but this is not available in the free home version. However, this solution is offered, both for operating Windows networks, and macOS. In this review article, we will look at NetSpot Free versions 2.8 is a free, significantly stripped-down version of the company's paid products for home and corporate use.
The NetSpot Discover tab is a WiFi scanner. Despite the simple graphical interface, it has a modern appearance, and the network details of each SSID are displayed in bold and clearly visible. Signal levels are shown in negative dBm values (current, minimum and maximum), as well as in percentage. Hidden networks are not displayed in the free version, and the ability to export data is not supported (although there is such a button, but it is not active).
When you click on the "Details" button at the bottom of the application window, combined graphs of signals and used channels for each WiFi band are displayed, generated for the SSIDs selected from the list of networks. In addition, the signal information of each SSID is displayed in a table view, so you can see the exact values received by the application during each scan.
In general, the free version of NetSpot does a good job of discovering WiFi networks (although it does not support working with hidden networks). And yet, the free solution has very limited functionality, as we are eloquently told by broken links to a large number of additional features- this is the inaccessibility of visualizations, and the inability to use a heat map, and the lack of export.
WirelessNetView (Windows)

WirelessNetView is a small utility from the NirSoft web resource that works in background and monitors the activity of wireless networks around you. It is offered free of charge for personal and commercial purposes. This is a fairly simple WiFi scanner, available in both portable and installable forms. Within the framework of this article, version 1.75 is considered.
The graphical user interface of the WirelessNetView solution is not very fancy - it's just a window with a list of wireless networks. For each detected network, the following information is available: SSID, signal quality at the current time, average signal quality over the entire observation time, detection counter, authentication algorithm, information encryption algorithm, MAC address, RSSI, channel frequency, channel number, etc. .
Thus, this utility provides signal level indicators in negative dBm values, as well as in percentage terms for the last received signal and the average indicator for the entire observation time. But it would be even better if we also had access to the average values for the RSSI of a particular access point over the entire observation period. Another unique piece of available analytics that WirelessNetView offers is how often each SSID is discovered, which can be useful in certain situations.
Double-clicking on any of the detected wireless networks will open a dialog box with all the details about specific network, which can be very convenient, since your screen is clearly not wide enough to view all the details in the main list. Right-clicking on any network from the list allows you to save the data for that specific wireless network or all detected networks to text or HTML files. The Options toolbar menu displays some options and additional functionality such as filtering, MAC address format, and other information display preferences.
Please note that this utility lacks a number of advanced features that we expect to see in modern WiFi scanners. First of all, it is about graphical representation information, full support for the 802.11ac standard and, accordingly, the recognition of all channels occupied by an access point that can use a large channel width. However, the WirelessNetView solution can still be useful for simply monitoring wireless networks or a small WiFi space, especially if you find some of the unique functionality this utility valuable for themselves.
Wireless Diagnostics (macOS)

Starting with OS X Mountain Lion v10.8.4 and later operating systems Apple company provides the Wireless Diagnostics tool. It is more than just a WiFi scanner; it can help detect and fix WiFi connection problems. But best of all, it's a native toolkit included with the operating system. As part of this review, we will look at the Wireless Diagnostics software solution included with MacOS High Sierra(version 10.13).
To get started, press the Option key and then click the Airport/WiFi icon at the top of MacOS. You will have more detailed information about your current WiFi connection, as well as access to the "Wireless Diagnostics" shortcut.
Opening Wireless Diagnostics will launch a wizard called "Assistant" that may ask for additional information such as the make and model of the router and its location. Tests will then run to detect problems. Once validated, a summary of the results will be shown, and clicking on the icon for each result will show expanded details and suggestions.
While not entirely obvious, there are also more tools available to you than just the aforementioned wizard. While the Wizard dialog box is open, clicking the Window button at the top of the toolbar will provide access to additional utilities.
The "Scan" utility is a simple WiFi scanner that shows the usual data about detected wireless networks, as well as short description network types and best channels. One of its main advantages is that it shows noise levels in WiFi channels, which most of the scanners for Windows OS presented in this article do not show. However, it would be more convenient if all the channels that use specific SSIDs with a larger channel width were listed, and not just the channel width and the center channel were shown.
The Info utility shows the current network connection and detailed detailed information about signal characteristics. The "Logs" utility allows you to configure the WiFi, EAPOL and Bluetooth diagnostic protocols. Performance utility shows line graphs of signal and noise, signal quality and bit rate current connection. The "Sniffer" utility allows you to capture raw wireless packets, which can then be exported to a third-party packet sniffer.
Thus, the utilities included in the Wireless Diagnostics toolkit for the macOS operating system family are truly impressive, especially when compared to the native wireless diagnostics toolkit for Windows operating systems. You always have a WiFi scanner at hand (which even shows noise levels) and a packet capture option (followed by the ability to export), and their troubleshooting "Assistant" seems really smart. However, for the visualization of WiFi channels, in our opinion, there is not enough channel usage graph.
In addition, Apple offers an excellent tour and guide to using Wireless Diagnostics for more information.
conclusions
Each of the diagnostic programs we have reviewed WiFi networks has its advantages and disadvantages. At the same time, all these solutions, judging by user reviews, are worthy of being downloaded and evaluated in action. Choice optimal program for each specific case will be different. So try it!