What is debug exe utility. Working with the Windows command line, the Debug program and its use
1)
Run Virtual PC 2007 with a Windows XP image. Switch the OS to command line mode.
Start -> Run -> Type cmd and press Enter.
2)
Get and commit help on debug command options
In the console: type debug , then (?).
Short list of all commands:
A (assemble) - Translation of assembler commands into machine code. The default address is CS:0100h.
C (compare) — Comparison of the contents of two memory areas. The default is D.S.. The command specifies either the length of sections or a range of addresses.
D (dump) - Display the contents of the memory area in hexadecimal and ASCII formats. The default is D.S.. You can specify length or range.
E (enter) - Entering data or machine code instructions into memory. The default is D.S..
F (fill) — Filling the memory area with data from the list. The default is D.S.. You can use both length and range.
G (go) - Execution of a debugged machine language program up to a specified breakpoints. The default is D.S.. In doing so, you should make sure that IP contains a valid address.
H (hexadecimal) - Calculation of the sum and difference of two hexadecimal values.
I (input) - Reading and outputting one byte from the port.
L(load) — Loading a file or data from disk sectors into memory. . Default - CS:100h. The file can be specified using the command N or argument at startup debug.exe.
M (move) - Copying the contents of memory cells; default is used D.S.
N (name) - Specifying a file name for commands L (LOAD) And W (WRITE).
O(output) — Sending a byte to the output port.
P (proceed) - Execution of instructions CALL, LOOP, INT (loop, interrupt, procedures) or a repeated string instruction with prefixes REPnn, moving on to the next instruction.
Q (quit) - Completion of work debug.exe. Without saving the test file.
R (register) - Output the contents of the registers and the next instruction.
S (search) — Search in memory for characters from the list. The default is D.S.. You can specify both length and range.
T (trace) - Step by step execution of the program. Like in a team P, the default pair is CS:IP. But to perform interrupts, it is better to use the command P.
U (unassemble) - Disassembly of machine code. The default is pair CS:IP.
w (write) — Writing a file from debug.exe to disk. You must specify the file name with the command N if it hasn't been loaded.
3)
Obtaining and fixing dumps of characteristic areas of RAM and ROM
Let's type the R command.
Registers CS, D.S., ES, SS at this point initialized the address of the 256-byte program segment prefix, and the in-memory workspace will start with addresses of this prefix + 100h.
Command set rules:
A) B debug.exe case is not distinguished.
B) Spaces in commands are used only to separate parameters.
C) The entered numbers must be in the hexadecimal number system, and without final letter h.
D) The segment and offset are written using a colon, in the format segment:offset.
4)
Viewing a memory area.
Team D, allows you to view the contents of individual memory areas.
Let's check the amount of memory available for work. To do this, enter: d 40:13 and Enter.
The first two bytes that appear on the screen as a result contain the size of the memory in kilobytes and in hexadecimal representation, and the bytes are in reverse order. We have this: 8002 0280 640 (K)
- Address of the first left byte shown in the format segment:offset.
- The hexadecimal representation of a paragraph (16 bytes) starting at the byte specified at the beginning of the string.
- The characters of the same paragraph in ASCII format.
4)
Checking parallel and serial ports.
The first 16 bytes of the BIOS data area contain the addresses of the parallel and serial ports. The first eight bytes printed indicate the addresses of the serial ports COM1-COM4. The next 8 bytes indicate the addresses of the parallel ports LPT1-LPT4. Port address 78 03 - written in reversed form.
5)
Checking the status of the keyboard register.
In the data area BIOS by the address 417h the first byte is located, which stores the state of the keyboard register.
6)
Checking BIOS production date.
Copyright information for BIOS built into ROM BIOS by the address FE00:0. The line with the copyright can be easily found in ASCII-sequences, and serial number- as a hexadecimal number. On the screen we see the seven-digit number of the computer and the copyright date. Although, the copyright line may be long and not fit into the output area of memory. In this case, you just need to enter again D.
The date is also recorded in ROM BIOS starting from address FFFF:5. After executing the corresponding command in ASCII-sequence will be this date, written in the format mm/dd/yy.
7)
An example of machine codes.
Consider the creation of a program in machine language, its representation in memory and the results of execution. Debugger Command A (Assembly) translates DEBUG into the mode of receiving assembly instructions and translating them into machine codes.
Now that the program is in memory, let's try to control its execution. First, let's check the current state of the registers and flags, for this we enter the command R.
IP- a register containing the address-offset of the next instruction to be executed, relative to the code segment CS in x86 family processors.
Register IP Connected with CS as CS:IP, Where CS is the current code segment, and IP— the current offset relative to this segment.
Register IP is a 16-bit pointer register. In addition to it, registers of this type include SP (stack pointer- stack pointer) and BP (Base Pointer- base pointer).
Recording CXpassed successfully and is equal to 8. Segments have been initialized D.S., ES, SS, CS the same address. Register IP contains 0100 , indicating that instructions are executed at offset 100h from CS (we started with it).
Meaning |
Description |
No overflow |
|
Direction up or right |
|
Enable interrupts |
|
positive sign |
|
non-zero value |
|
No additional transfer |
|
odd word |
|
| 0
B16
- address of the code segment.
Let's execute it. It is necessary to tell the debugger the addresses of the first and last commands that need to be viewed (We have 100 and 107). The instructions in the specified range will appear, in assembler, in machine code, as well as the address of each instruction. Execute the program step by step using the command T. Using the second command T, we followed the instruction MOV. The machine code of the instruction operand is − 00D8. Operation adds AL To BL. To exit, enter Q. And again disassemble the created testpi.com.
Modifying or copying the code BIOS may infringe manufacturer's copyright BIOS. BIOS may be copied or modified for personal use only and not for distribution. Typical Copy Procedure BIOS using the program DEBUG we present below. This procedure will save the entire 64 KB segment in the file from the address F000:0000h By F0000:FFFFh. Conclusions:
|
OllyDbg 2.0 is a User Space level debugger that has become very popular among users around the world. There are a lot of plugins written for OllyDbg now, so it's a pleasure to work with it. OllyDbg has good functionality, which makes it suitable for solving various problems and examining code of any complexity. The debugger interface is fully customizable: the background of the working windows, the color and size of the font, the highlighting of certain assembler instructions, and much more.
Key features and functions
Interface:
- The interface consists of program code windows, registers, stack, and memory dump. The background and font color can be set to your liking. At the very top of the button quick access to the main functions, and the most frequent operations.
Functions:
- a list of functions used in the debugged program;
- list of string variables found in the program;
- a list of handles for the controls of the program being debugged, such as: window, buttons, checkboxes (CheckBox), toolbars, and more;
Breakpoints. It is possible to set several breakpoints (including at the same time):
- for a specific function
- to a specific address
- to a Windows message;
- to read from memory;
- to write to memory;
- on memory access (reading and writing);
- to a specific sequence of code instructions;
You can specify separate specific conditions for breakpoints, for example, a specific value of a specified register, and much more. The function of writing to a log file is supported.
Stack:
- Values on the stack are commented to make it easier to understand function arguments.
Trace:
- when stepping through the code, before each instruction, the debugger suggests the current value of the memory addresses on which operations are performed.
Finding values in memory:
- search for ASCII and Unicode strings is supported, as well as hex values.
Code window:
- the program code is accompanied by comments, such as function names, their arguments, variable values, and more.
Debugging Tools for Windows- Operating code debugging tools Windows systems. They are a set of freely distributed programs from Microsoft designed for debugging user-mode and kernel-mode code: applications, drivers, services, kernel modules. The toolkit includes console and GUI debuggers, utilities for working with symbols, files, processes, utilities for remote debugging. The toolkit contains utilities with which you can find the causes of failures in various components of the system. Debugging Tools for Windows from a certain moment are not available for download in the form of a standalone distribution and are part of the Windows SDK (Windows Software Development Kit). Instrumental set Windows tools The SDK, in turn, is available as part of the MSDN Subscription Program, or can be freely downloaded as a separate distribution from msdn.microsoft.com. According to the developers, the latest and greatest current version Debugging Tools for Windows is contained in the Windows SDK.
Debugging Tools for Windows are updated and made available to the public quite often, and this process does not depend on the release of operating systems. Therefore, periodically check for new versions.
Let's now see what, in particular, the Debugging Tools for Microsoft Windows:
- Debug local applications, services (services), drivers and kernel;
- Debug over network remote applications, services (services), drivers and kernel;
- Debug running applications in real time;
- Analyze memory dump files of applications, the kernel and the system as a whole;
- Work with systems based on x86/x64/Itanium architectures;
- Debug user-mode and kernel-mode programs;
The following versions of Debugging Tools for Windows are available: 32-bit x86, Intel Itanium, 64-bit x64. We need two of them: x86 or x64.
There are several ways to install Debugging Tools for Windows, in this article we will consider only the main ones:
- Installation via web installer.
- Installing Debugging Tools for Windows from ISO Windows image SDK.
- Installing Debugging Tools for Windows directly from the dbg_amd64.msi /dbg_x86.msi packages.
It remains unclear at what point, why should I install debugging tools on a computer? Often, after all, you are faced with a situation where intervention in working environment highly undesirable! And even more so since the installation of a new product, that is, making changes to the registry / system files, may be completely unacceptable. Mission-critical servers are examples. Why don't developers consider portable versions of applications that don't require installation?
From version to version, the process of installing the Debugging Tools for Windows package undergoes some changes. Let's now jump straight into the installation process and look at the ways in which the toolkit can be installed.
Installing Debugging Tools for Windows Using the Web Installer
Go to the Windows SDK Archive page and find a section called Windows 10 and below the item "Windows 10 SDK (10586) and Microsoft Windows 10 Mobile Device Emulator (version 10586.11)".
Click on an item INSTALL SDK. After clicking, download and run the sdksetup.exe file, which initiates the process of online installation of the Windows SDK. At the initial stage, the installer will check if the .NET Framework package is installed on the system latest version(currently it is 4.5). If the package is missing, the installation will be offered and the station will be rebooted when finished. Immediately after the reboot, at the stage of user authorization, the installation process starts directly with the Windows SDK.

Often, when choosing all the components of the package without exception, errors may occur during the installation process. In this case, it is recommended to install components selectively, the minimum required set.
After the installation of Debugging Tools for Windows location debug files when this method our installation will be as follows:
- 64-bit versions: C:\Program Files (x86)\Windows Kits\x.x\Debuggers\x64
- 32-bit versions: C:\Program Files (x86)\Windows Kits\x.x\Debuggers\x86
* where x.x is a specific version of the development kit;
We noticed that versions 8 and higher, the installation paths are noticeably different from the classic ones for everyone previous versions debugging tools?
A huge plus this method Installing Debigging Tools for Windows is to install versions of debugging tools for all architectures at once.
Installing Debugging Tools for Windows from the Windows SDK ISO
This method involves installing Debugging Tools for Windows using the full Windows SDK (Software Developers Kit) installation image. Until a certain time, you could download the ISO image for the corresponding system on the Windows SDK Archive page. However, at the moment, you can get an ISO image of the SDK by running the web installer sdksetup.exe , and selecting the item Download the Windows Software Development Kit in the start window of the installer:
As it was found out, the previous installation method using the web installer is quite capricious and often fails. On clean systems, it installs without problems, but on sufficiently loaded systems, numerous problems arise. If this is the case for you, then use this method.
Accordingly, on the page you need to select the required distribution kit, for me (and I think for many) at the moment it is " Windows package SDK for Windows 7 and .NET Framework 4" and click on the link "Get DVD ISO image" below.
When working with the msdn.microsoft.com site, I advise you to use Internet browser Explorer because competing products have been seen to not work!
Accordingly, it is necessary to choose only as necessary. Usually the bitness of Debugging Tools for Windows is the same as the bitness of the system. My test systems are mostly 64-bit, so in most cases I download the image for the 64-bit system GRMSDKX_EN_DVD.iso .
Then, after downloading the image, we need to somehow work with the existing ISO image. The traditional way is, of course, burning a CD, but this is a rather long and sometimes costly method. I propose to use free utilities to create virtual disk devices in the system. Personally, I prefer to use the DEAMON Tools Lite program for this purpose. Someone may have other preferences, more direct or lightweight utilities, in taste and color, as they say .. After installing DAEMON Tools Lite, I simply double-click on the GRMSDKX_EN_DVD.iso image file and I have a new virtual CD:

Then, by double-clicking, I activate autoload and start the installation of the Windows SDK:

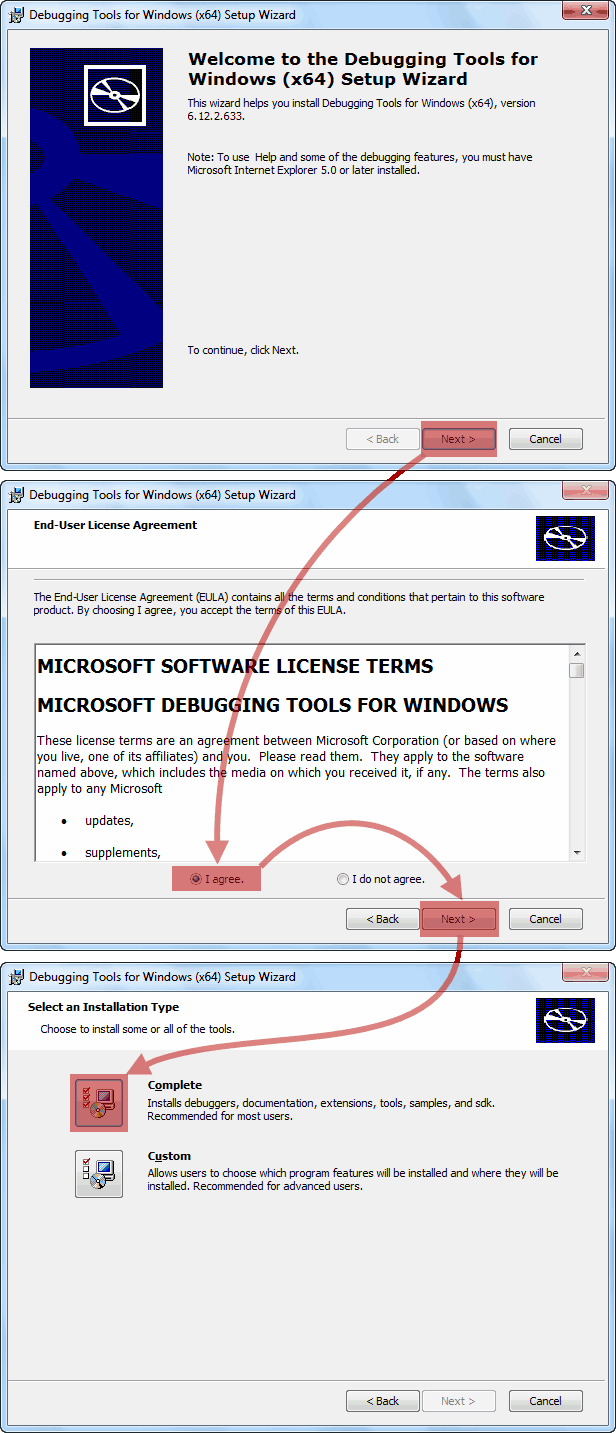
When the turn comes to select the components to be installed from the list, we disable absolutely all options except those marked in the screenshot. This will help us avoid unnecessary mistakes now.

That's right, the screenshot shows two options: "Windows Performance Toolkit" and "Debugging Tools for Windows". Choose both, because the Windows Performance Toolkit will certainly come in handy in your work! Further, after clicking the "Next" button, the installation continues in normal mode. And at the end you will see the inscription "Installation Complete".
Upon completion of the installation, the working directories of the Debugging Tools for Windows kit will be as follows:
- For x86 version:
- For x64 version:
This completes the installation of Debugging Tools for Windows.
Installing Debugging Tools for Windows via .msi file
In case of problems during the installation of Debugging Tools for Windows in the two previous ways, we still have one more, the most reliable and time-tested one, which helped out, so to speak, more than once. Once, before integration into the Windows SDK, Debugging Tools for Windows were available as a separate .msi installer, which can still be found, but already in the bowels of the Windows SDK distribution. Because we already have Windows ISO SDK, then we can not mount it into the system, but simply open it using the well-known WinRAR archiver, or any other product that works with the contents of ISO disks.

After opening the image, we need to go to the "Setup" directory located at the root and then select one of the directories:
- To install the 64-bit version: \Setup\WinSDKDebuggingTools_amd64 and unpack the dbg_amd64.msi file from this directory.
- To install the 32-bit version: \Setup\WinSDKDebuggingTools and unpack the dbg_x86.msi file from this directory.
Upon completion of the installation, the working directories of the Debugging Tools for Windows kit will be as follows:
- For x86 version: C:\Program Files (x86)\Debugging Tools for Windows (x86)
- For x64 version: C:\Program Files\Debugging Tools for Windows (x64)
At this point, the installation of Debugging Tools for Windows can be considered completed.
additional information
I don't know what it is connected with, maybe with my carelessness, but after installing the Debugging Tools for Windows, the installer does not set the path to the directory with the debugger in the Path system path variable. This imposes certain restrictions on running various debugging tasks directly from the console. Therefore, in the absence of a path, I myself write in the window Environment Variables path to debugging tools:
- C:\Program Files (x86)\Windows Kits\10\Debuggers\x86
- C:\Program Files (x86)\Windows Kits\10\Debuggers\x64
* In your case, the paths may differ both due to the use of an OS of a different bitness, and due to the use of an SDK of a different version.
The utilities of the Debugging Tools for Windows package can work as portable applications, you just need to copy the directory from the working system Microsoft Windows Performance Toolkit and use it as a portable version on a production server. But do not forget to take into account the capacity of the system !! Even if you have made a complete installation of the package on a critical system, then you can start working right after installation, no reboot is required.
Debugging Tools for Windows
And now, finally, here is the composition of Debugging Tools for Windows:
| File | Purpose |
|---|---|
| adplus.doc | Documentation for the ADPlus utility. |
| adplus.exe | A console application that automates the work of the cdb debugger to create dumps, log files for one or more processes. |
| agestore.exe | A utility for removing obsolete files from the storage used by the symbol server or source server. |
| breakin.exe | A utility that allows you to send a custom break combination to processes, similar to pressing CTRL+C. |
| cdb.exe | User mode console debugger. |
| convertstore.exe | Utility to convert characters from 2-tier to 3-tier. |
| dbengprx.exe | Ripiter (proxy server) for remote debugging. |
| dbgpc.exe | A utility for displaying information about the status of an RPC call. |
| dbgsrv.exe | The server process used for remote debugging. |
| dbh.exe | A utility for displaying information about the contents of a symbol file. |
| dumpchk.exe | Dump verification utility. A utility for quickly checking a dump file. |
| dumpexam.exe | A utility for analyzing a memory dump. The result is output to %SystemRoot%\MEMORY.TXT . |
| gflags.exe | Editor of global system flags. The utility manages registry keys and other settings. |
| i386kd.exe | Wrapper for kd. Once it was called kd for systems on Windows base NT/2000 for x86 machines? Probably left for compatibility reasons. |
| ia64kd.exe | Wrapper for kd. Was that what kd was once called for Windows NT/2000 based systems for ia64 machines? Probably left for compatibility reasons. |
| kd.exe | Kernel-mode console debugger. |
| kdbgctrl.exe | Kernel debug management tool. Utility for managing and configuring the kernel debugging connection. |
| kdsrv.exe | Connection server for KD. The utility is a small application that runs and waits for remote connections. kd runs on a client and connects to that server for remote debugging. Both server and client must be from the same Debugging Tools assembly. |
| kill.exe | Utility to end processes. |
| list.exe | A utility for displaying the contents of a file on the screen. Included is this miniature utility turned out to be for one purpose - viewing large text or log files. It takes up little memory space, as it loads the text in parts. |
| logger.exe | A tiny debugger that can only work with one process. The utility injects logexts.dll into the process space, which records all function calls and other actions of the program being examined. |
| logviewer.exe | A utility for viewing logs written by the logger.exe debugger. |
| ntsd.exe | Microsoft NT Symbolic Debugger (NTSD). A debugger that is identical to cdb, except that it creates a text window on startup. Like cdb, ntsd is capable of debugging both console applications and graphical applications. |
| pdbcopy.exe | A utility for removing private symbols from a symbol file, controlling public symbols included in a symbol file. |
| remote.exe | Utility for remote debugging and remote control of any KD, CDB and NTSD console debugger. Allows you to run all these console debuggers remotely. |
| rtlist.exe | Remote Task Viewer. The utility is used to list running processes through the DbgSrv server process. |
| symchk.exe | A utility to download symbols from the Microsoft symbol server and create a local symbol cache. |
| symstore.exe | Utility for creating network or local storage of symbols (2-tier/3-tier). A symbol store is a specialized directory on disk that is built according to a certain structure and contains symbols. In the root directory of the symbols, a subfolder structure is created with names identical to the names of the components. In turn, each of these subfolders contains nested subfolders with special names obtained by hashing binary files. The symstore utility scans component folders and adds new components to the symbol store where any client can retrieve them. The symstore is said to be used to get symbols from the 0-tier storage and put them into the 2-tier/3-tier storage. |
| tlist.exe | Task Viewer. A utility for listing all running processes. |
| umdh.exe | User-mode dump heap utility. A utility for analyzing heaps of a selected process. Allows output various options for the heap. |
| usbview.exe | USB viewer. utility to view USB devices connected to a computer. |
| vmdemux.exe | Demultiplexer virtual machine. Creates multiple named pipes for a single COM connection. Channels are used to debug various components of the virtual machine |
| windbg.exe | User mode and kernel mode debugger with GUI. |
The driver is essentially a link between the operating system, that is software and iron, that is physical devices such as video cards, printers, processors, etc. IN operating system basic drivers for the most necessary devices - mouse, keyboard - can be installed, but for everything else, fresh drivers will be required.
How to install the driver?
1.Easiest way if available setup file, you just need to run it and follow the instructions of the installer.2.If there is no installer available, but only files with *.inf, *.dll, *.vxt, *.sys, *.drv. extensions are present, then the algorithm of actions should be something like this:
a) First you need to select the icon on the desktop ( My computer) and click on it right click mouse, in the drop-down menu select ( Properties).
b) Now go to the tab ( Equipment) and press the button ( device Manager).

c) Now you need to select the device for which the driver will be installed/updated. On the line with the device, right-click and select in the drop-down menu ( Properties), or you can simply double-click on it to go to the desired settings. 
d) Go to the tab ( Driver), select the button ( Refresh).

e) In the dialog box that appears, select the item ( No not this time) and go ( Further).
f) There are two options at this stage. You can try to install the drivers in automatic mode, then the OS itself will try to find drivers suitable for the device and install them, for this we select ( Automatic installation(recommended)), if the attempt fails, then go to the second step ( Installation from a specified location) and choose ( Further).

g) This menu item implies a choice between searching for a driver on removable media and the option to specify the folder with the driver yourself. Therefore, if there is a disk with drivers available, then you need to insert the disk into the CD-rom and select the option ( Search on removable media (floppies, CDs..)) and go ( Further).
If the driver is found and downloaded on the Internet on your own, then you must manually specify the path to the folder in which the installation data for the driver is located as follows. Select item ( Include the following search location:) and go to ( Review), now select the folder with the driver from the list and click on the button ( OK). Now boldly move on Further), if everything is done correctly, the installation of the necessary driver will begin.